rma(
  yi = g,
  vi = vg,
  method = "EE",
  data = some_tib
)6 Assessment support
6.1 Reproducibility tips
Model structure
First thing to consider when working with a paper is identifying how the meta-analysis itself is structured. Some meta-analyses will only report the overall pooled effect. This is common in more niche fields with fewer studies (or in older meta-analyses), which makes it difficult to test for moderators. A paper may report one outcome or multiple - in the latter case, each outcome will constitute a separate meta-analysis. Most meta-analyses these days will include a moderation analysis of some description.
Meta-regression and subgroup analysis
Beware confusing terminology - authors may report a “meta-regression” if they’re evaluating a continuous moderator, or a “sub-group analysis” if they have a categorical moderator or if they ran two or more separate meta-analyses for each category of their moderator. These all fall under moderation analysis.
Moderator models may include all moderators at once, as you would when modelling a theoretically driven model. More often than not, authors will try moderators one by one, otherwise they would lose all the rows which don’t have information about all the moderators in the model.
Fixed, random, and mixed-effects models
Sometimes authors will report “mixed effects models”. This means that the overall effect size gets estimated using fixed effects, and the moderators are estimated using random effects. This is the default when running rma with moderators. If a meta-analysis is fully based on random effects, the overall effect size would be reproduced by the output from rma without moderators, while a separate model would be then fitted to get the moderator effects (this is the approach we demonstrated in the sessions).
Other times, researchers will fit the overall model using random effects, while the moderator models are fitted using fixed effects. The justification often is that because the moderators are meant to “explain away” heterogeneity, we no longer need to worry about between-study variability (beyond random sampling).
Reproducibility notes
If we want to be able to improve an analysis in some way, we need to be able to reproduce it. This is because if we don’t confirm that we’re following the same steps as the original authors, we cannot be sure whether any differences in our results are due to the improvement that we implemented, or because we’re running a different analysis altogether.
When familiarising yourself with a paper, make notes of the following:
- Identify the outcome(s). Choose one which you will re-analyse. Check the dataset to see if there is a column clearly identifying it.
- Identify the model type (fixed effects, random effects, other?)
- Identify the effect size type - what kind of relationship does this effect size represent? Be specific about variables. Find the column containing the effect sizes in the dataset. Find the accompanying column containing the variance. Confirm whether you’re working with variance or standard error, or something else.
- What was the exact result of overall meta-analysis based on your chosen outcome? Highlight it in the document or note down the exact results.
- How much heterogeneity was there in the model for your chosen outcome? Note down exact values.
- Which moderators did the authors explore? Where can they be found in the paper?
- Choose one of the moderator and write down the results.
Once you have a plan based on the notes above, carry out the usual analytic steps, comparing to the values reported in the paper at each step:
- Visualise the data if possible
- Fit the overall model and the moderator model
- Evaluate the model fit with reference to heterogenity
- Report, interpret and write-up the results.
When checking whether you’ve fitted the right model, always look at the effect size, heterogeneity statistics, and the degrees of freedom - if there is a strong alignment between these three values as they are reported in the paper and your model output, you’re (probably) reproducing the steps correctly.
6.2 Coding tips
- Make full use of the
help()function to explore alternative arguments for the functions we’ve used. For example (assuming you have loadedmetafor), you can runhelp(rma)to open up the documentation for thermafunction. In particular, themethods = ...argument can specified if you want to use an estimator other than REML (the default). You can try different estimators if you’re struggling to reproduce the result. For example, the following code will fit the fixed effects model (“EE”, standing for “Equal effects”):
We also fit the “Hunter-Schmidt” estimator as:
rma(
  yi = g,
  vi = vg,
  method = "HS",
  data = some_tib
)
All the options are listed in the help documentation.
Use
emmeansto extract estimated means for different levels of the moderators.Format your results into nice tables with appropriate headings where relevant - the
display()function can help with this.If variable names contain special characters, like parentheses or spaces, you might need wrap them into “backticks” often located on the left of the Z key on the keyboard. For example:
# this would throw an error:
rma(yi = g, vi = vg,
    mods = ~ terrible (variable name),
    data = some_tib)

# this would work:
rma(yi = g, vi = vg,
    mods = ~ `terrible (variable name)`,
    data = some_tib)
Don’t include any raw output in your report. If you’re reporting the result of a model, you can either arrange it into a table, or report it in text instead of printing the whole output from an
rmaobject.Structure your code in a way that maximises the readibility of your report. This means hide unnecessary warnings and messages, and keep most of your code separate from the report. Revisit the materials on Canvas > An Adventure in Statistics > Units > Getting Started with R, RStudio and Quarto if you need a refresher on how to do this. There’s an example on how to organise code vs write-up below.
Example organisation
Coding
library(easystats)
library(tidyverse)
cars_plot <- ggplot2::ggplot(data = cars, aes(x = speed, y = dist)) +
geom_point() +
stat_smooth(method = "lm") +
theme_light()cars_lm <- lm(dist ~ speed, data = cars)
model_check_plot <- check_model(cars_lm)
parameters_tib <- model_parameters(cars_lm) |>
display()Report
cars_plot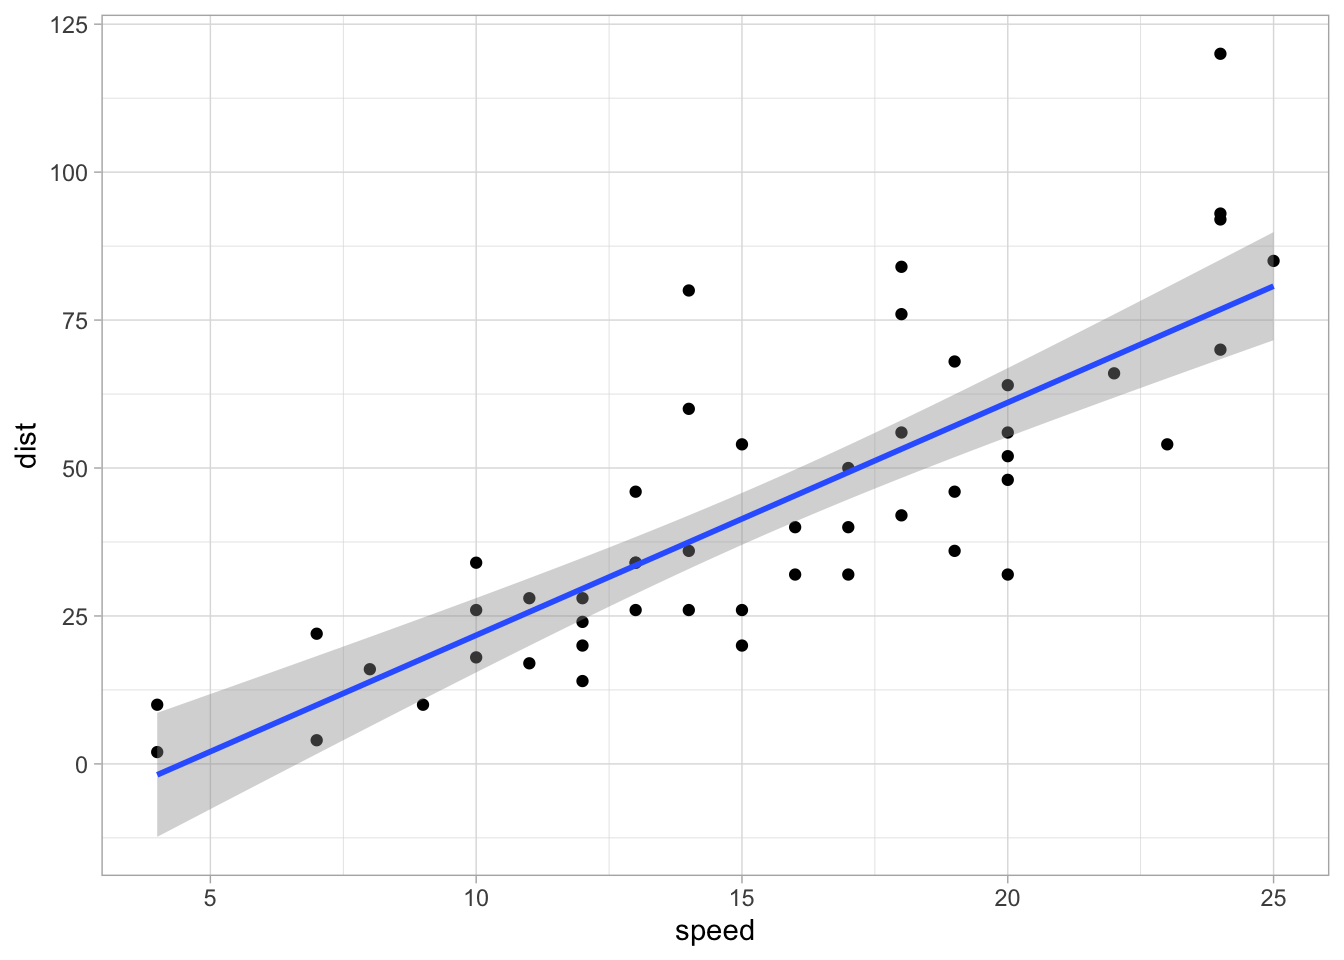
Figure 1 shows the relationship between stopping distance and speed of a car [small paragraph about the visualisation]
model_check_plot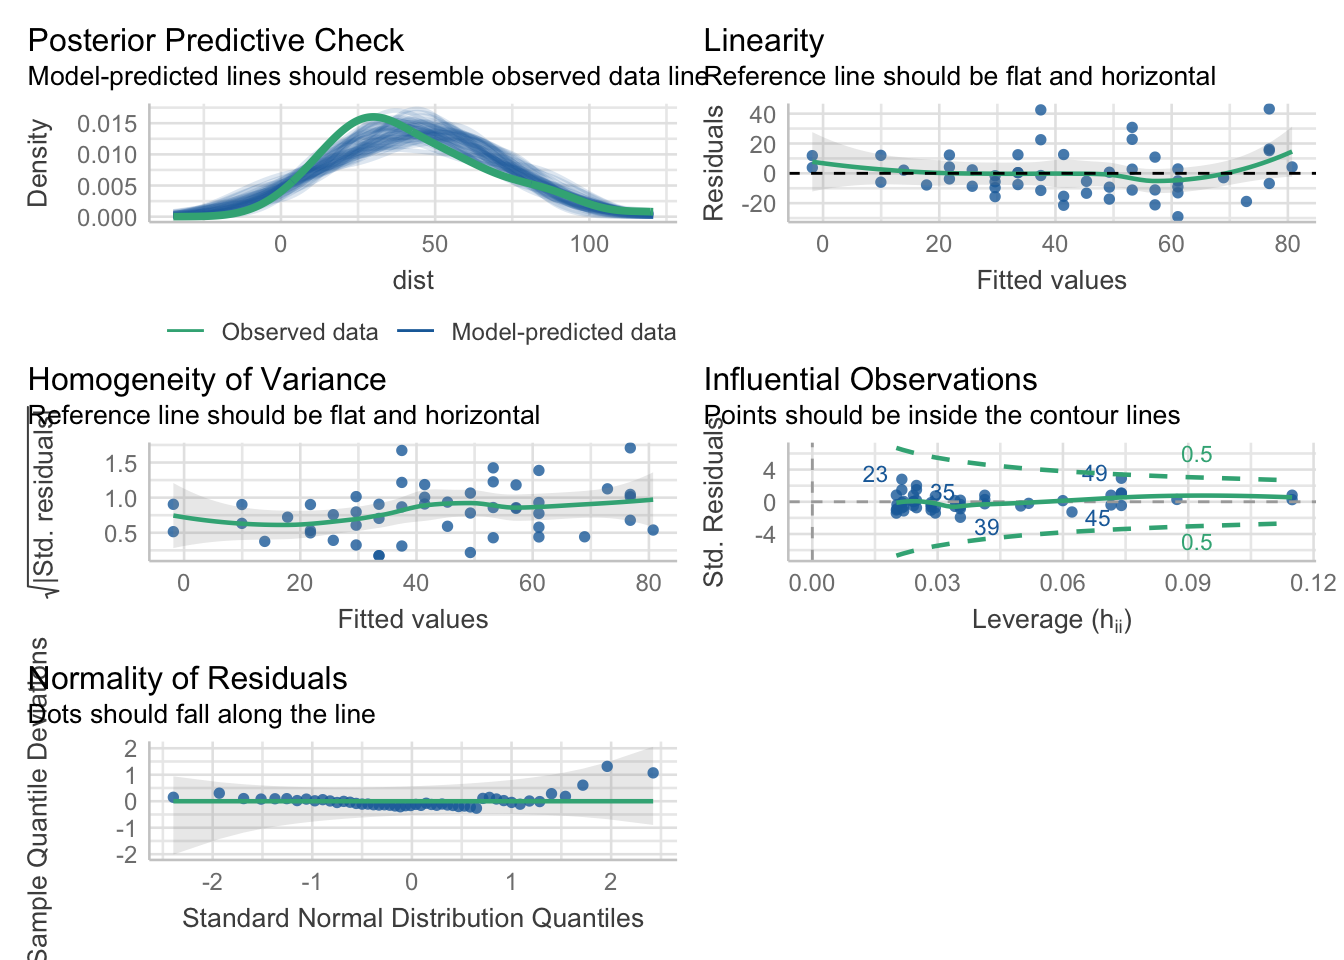
Residual diagnostics are showed in the plot above. We can see that… [paragraph about diagnostics]
parameters_tib| Parameter | Coefficient | SE | 95% CI | t(48) | p |
|---|---|---|---|---|---|
| (Intercept) | -17.58 | 6.76 | (-31.17, -3.99) | -2.60 | 0.012 |
| speed | 3.93 | 0.42 | (3.10, 4.77) | 9.46 | < .001 |
Parameter estimates are showed in Table 1. Speed was a statistically significant predictor of stopping distance [report and interpret model paramters].
6.3 Critical evaluation tips
Consider the issues we’ve discussed in Week 4 and especially in Week 5. How are the authors of the meta-analysis addressing these? Are they taking shortcuts where they shouldn’t? Are they showing awareness of the limitations of the methods they’re using, and if so, are they addressing these limitations? Are there any contradictions in the way they frame their report?
Focus primarily on the statistical aspects of the meta-analysis. Things like hypotheses and literature search strategy are also often subject to critique, but the aim of the assignment is to assess your understanding of statistical methods. An exception might be if the authors’ search strategy considerably undermines the results of their statistical analysis.
Evaluation can point out positives and negatives. If you notice something the authors did particularly well, make note of it.
If you come across a method with which you’re not familiar, look it up. Find a paper that explains it and, ideally, provides some evaluation of the method. Beware the “initial optimism” when reading methodological literature - when a method is developed, the authors will often proudly demonstrate their superiority over other methods. Later papers will typically provide a more balanced evaluation.
There’s more than one aspect of the meta-analysis that can be improved, and neither is the “best” one. The main thing to remember is to always justify what you’re doing, clearly articulate your reasoning so that an average researcher can understand you, and support your arguments with literature.
Conversely, the authors of the meta-analysis also have the responsibility to justify their decisions and support them with up-to-date literature. Is there evidence of this in their write-up?
When discussing the impact of your improvement, refer back to the original research question instead of just comparing the numbers. What do these new results imply practically? Do they challenge the authors’ conclusion in a meaningful way?